Trends in Small House Ownership
The study began by tracking trends in small houses (småhus) for permanent residences, using data spanning from 1981 to 2023. The primary finding was a steady increase in house ownership, with the index showing a clear upward trend, particularly in recent years. A unique pattern observed was a minor increase every three years, likely indicating fluctuations due to economic conditions or policy changes.
Five-Number Summary & Outliers
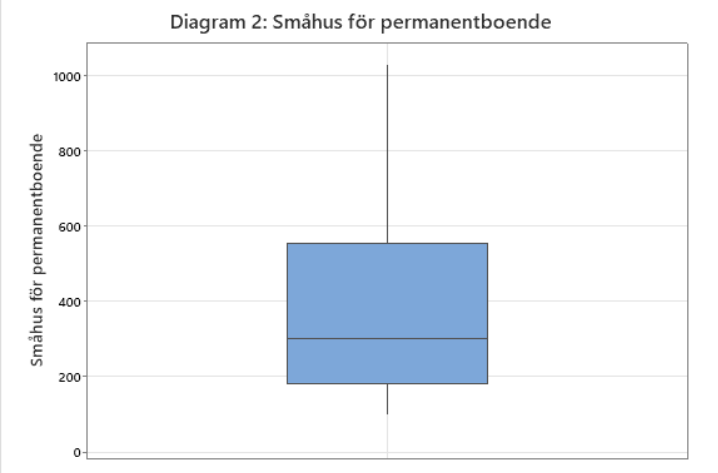
A five-number summary (minimum, Q1, median, Q3, and maximum) was calculated to describe the dataset’s spread and central tendency. Notably, the distribution was skewed, with a higher concentration of data points in recent years showing increased ownership. The upper and lower boundaries for outliers were also calculated, revealing that no values exceeded these boundaries, thus indicating no extreme outliers in the data.

Visual Analysis Through Box Plots
The data was represented visually in a box plot to confirm the five-number summary findings. The box plot highlighted a skewed distribution, with the median not positioned centrally, further illustrating an increase in ownership in later years.

Index Trend Analysis
The dataset’s highest values, observed in the last few years, suggest increased demand for small houses, while the lowest values in the early years indicate lower demand. This consistent rise in the index reflects changes influenced by economic factors and shifting lifestyle preferences over time.

Regression Analysis
A linear regression analysis was conducted to examine the relationship between consumer prices and housing index values. The regression showed a positive linear correlation, implying that as housing prices increased, consumer prices followed a similar trend. This finding aligns with economic theories suggesting that housing market trends can drive consumer price fluctuations.

Model Refinement
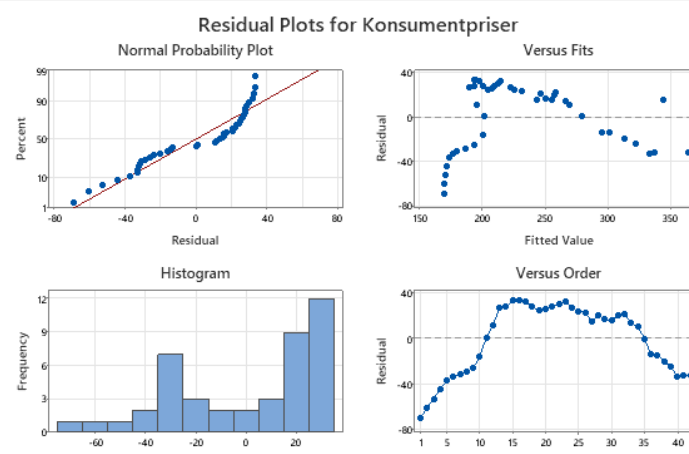
Two regression models were tested: one including all observations and another excluding certain older observations deemed unusual due to large residuals. Excluding these unusual observations improved the model’s predictive power, with the adjusted R-squared value increasing from 77.05% to 78.80%. This refined model was considered more accurate for forecasting future trends.
Challenges Encountered
1. Skewed Data Distribution
The dataset displayed a skewed distribution, with recent years showing higher values. This distribution complicated the interpretation of central tendencies and required additional statistical techniques to ensure accurate representation.
2. Outlier Identification and Interpretation
Although calculations indicated no outliers, interpreting the dataset without outliers was challenging given the presence of older, less typical values. Choosing whether to include these observations in the regression models required careful consideration, as their inclusion could skew results.
3. Residuals and Model Accuracy
Residuals for certain years posed a challenge in regression analysis. Some observations had large negative residuals, suggesting that actual values diverged significantly from the predicted trend. Addressing these residuals was crucial to refining the model’s accuracy and reliability.

